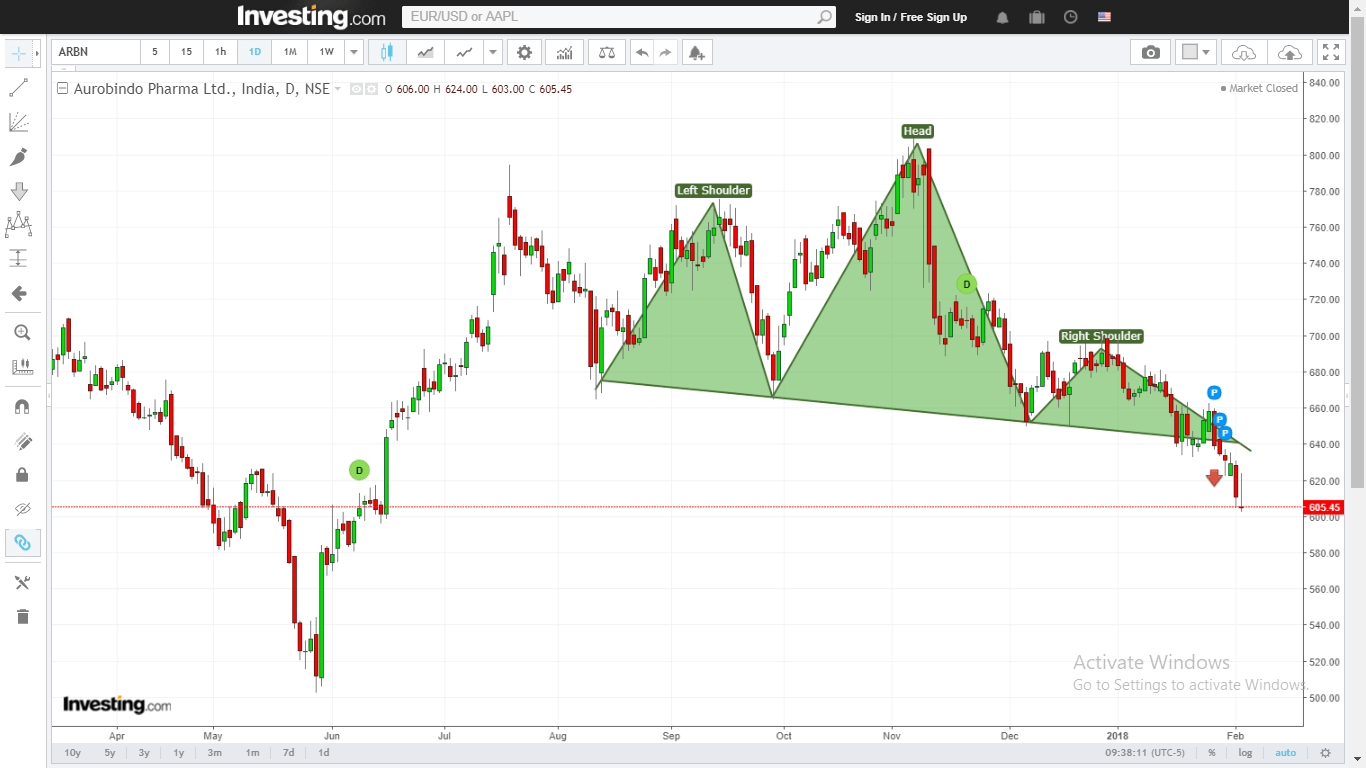
Auropharma Forms a Head and Shoulder Pattern . Selling opportunity for bears:
A falling head and shoulder pattern is a much reliable pattern as it occurs in a prevailing falling trend.
Here is the list of technical factors which reflects the bearish move is underway:
- On weekly charts , the stock price has formed a Double Top reversal pattern which breaks below 660 levels .
- On daily charts a head and shoulder pattern neck line breaks below 635 levels .
- Weekly MACD and Daily MACD both showing sell signals. ADX indicator also showing strength for sellers.
- Stock price is trading below its long term average of 200 day SMA and EMA on both daily and weekly charts.
- Put call ratio below 0.5 Also , highest call writers now at 620 levels.
- Open interest positions also suggesting that most of the positions are on shorter side.
- So selling this script is a conclusive result at bounce with a stop loss at 650 closing basis and first target for the position is 577 and then 560 also looks possible.
- Here is the snapshot: