NIFTY FORMS SYMMETRICAL TRIANGLE PATTERN BREAKOUT ON WEEKLY CHARTS .
JULY FUT of Nifty has given a breakout of a symmetrical triangle on weekly charts which shows a minimum upside of 11400 levels by the end of August…
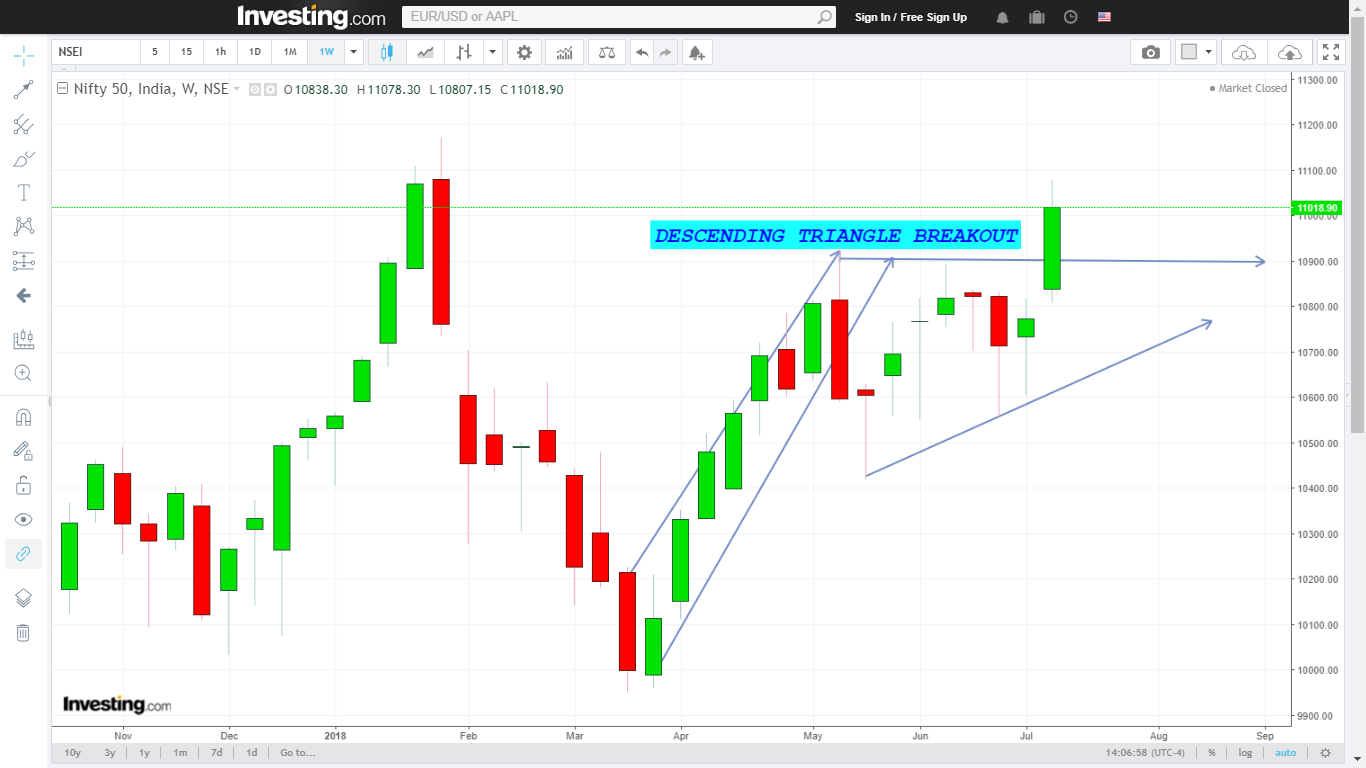
If we connect the tops and bottoms we observe many bullish price patterns occurring on the Nifty charts:
All the price patterns are reflected on weekly time frames:
Here is the snapshot:
1….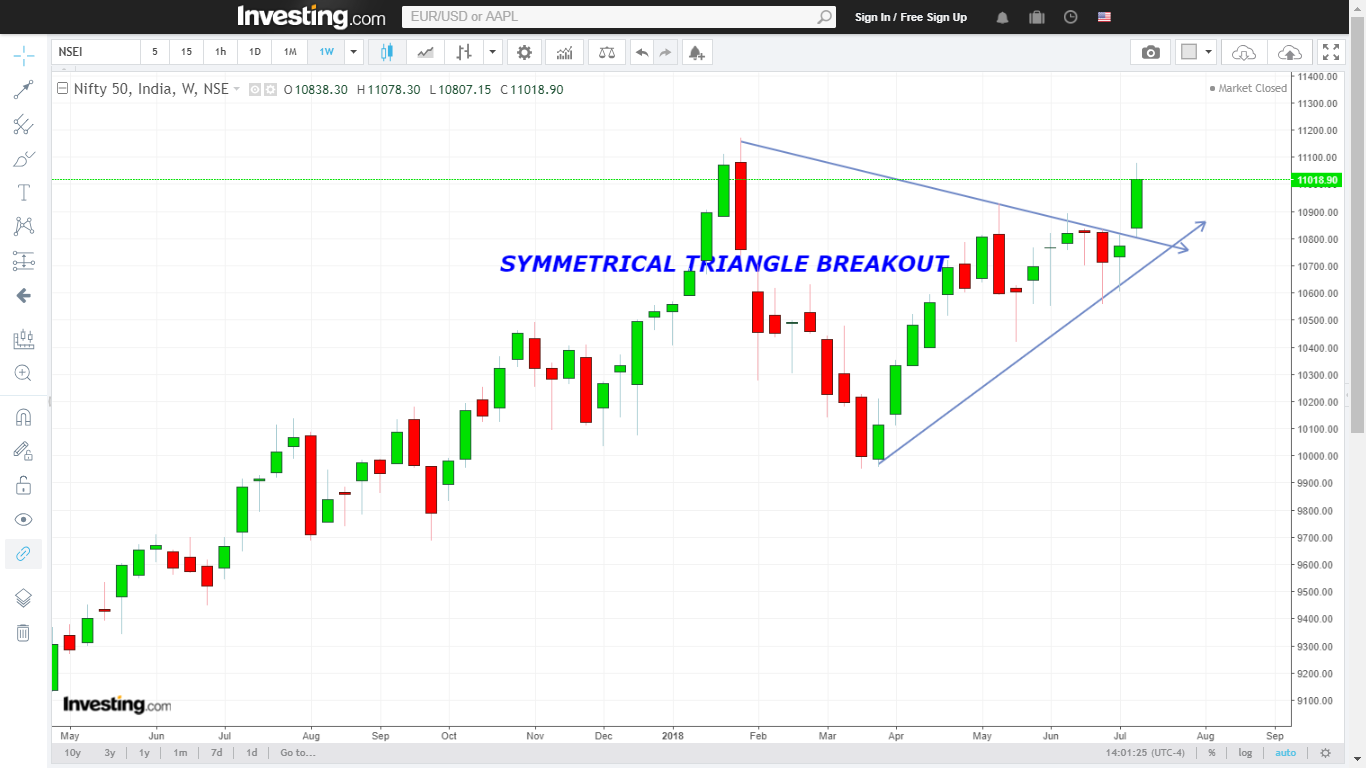
2.DESCENDING TRIANGLE FORMATION: