UGLY BOTTOM FORMATION IN ARVIND: BUY FOR 10% RETURNS FOR MARCH 2018 EXPIRY:
BUY ARVIND ON DECLINES AROUND 405 WITH STOP LOSS AT OR BELOW 397 CLOSING BASIS FOR THE TARGET OF 434,, AND IF CROSSES THEN 450 ALSO LOOKS QUITE POSSIBLE.
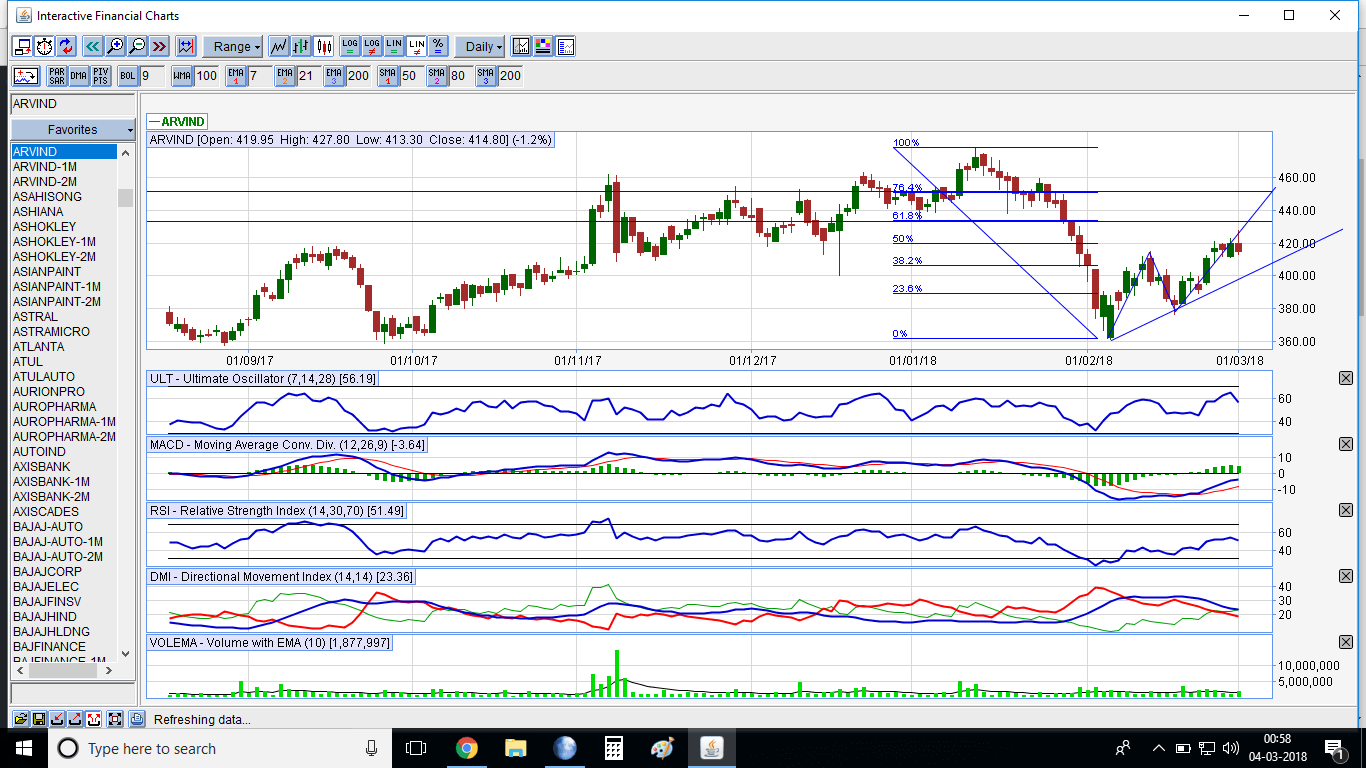
Technical references which shows the relation for the above mentioned stock are as follows:
1.EQUITY ANALYSIS:Although deliverable quantity is not so good for this script but volumes are playing a vital role as they have been extraordinary.
2. FUTURES MARKET ANALYSIS: Open interest suggests some profit booking as some liquidation has been observed during the last sessions trading. Liquidation of ITM calls and short build up of OTM call options suggest that the price is looking to have some time correction before moving on the higher sides.
3.TECHNICAL GRAPHS: An ugly bottom formation in the prices is a good solid one which is visible on daily charts.Also short time charts supporting the bullish formation as well on weekly charts a bullish cypher is also visible.Indicator study like MACD,RSI and ADX with DMI also supporting the same. 200 DAY EMA AND SMA holding the prices very well.
But its a cautious play as the markets are reacting on global events very much so always play with lots of cautiousness.
Here is the snapshot: