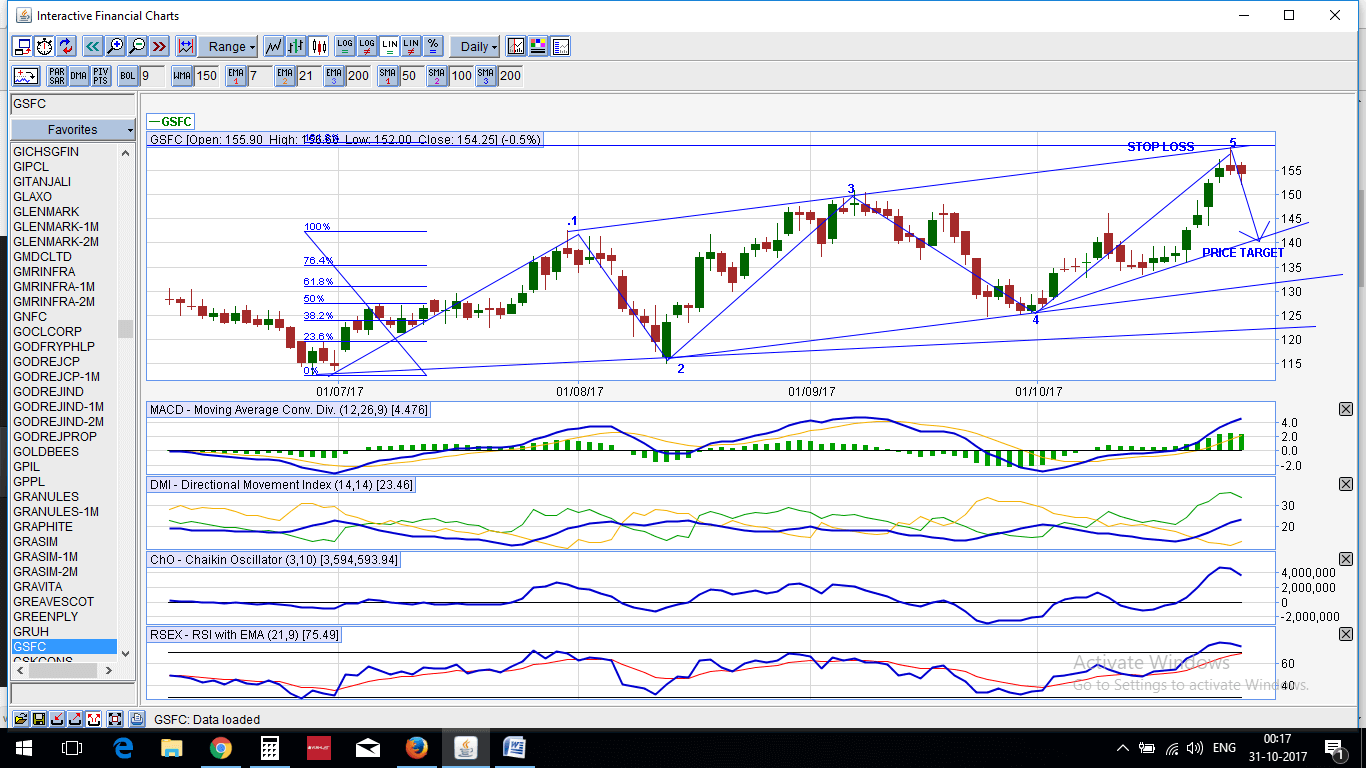
Bearish Wolf Wave Pattern formation in GSFC
A bearish wolf wave is a five wave pattern in which stock price forms higher tops and higher bottoms in a sytematic move and retrace around its major top and lowest bottom at 130% to 161% retracement.
At the highest top when it confirms the selling in the form of candle stick analysis we can initiate the sell with the stop loss at the highest point.
GSFC has formed an inverted hammer or also known as a shooting star pattern which is a highly reliable pattern when it confirms .
Now after observing the open interest data , on 30 th oct in november series I have seen addition of build up of new positions which seems to be on short side as the prices are loosing the momentum and also closing below the previous closing price.
So selling initiated at tops with a stop loss at 160 for the minimum target of 140.
Here is the snapshot: