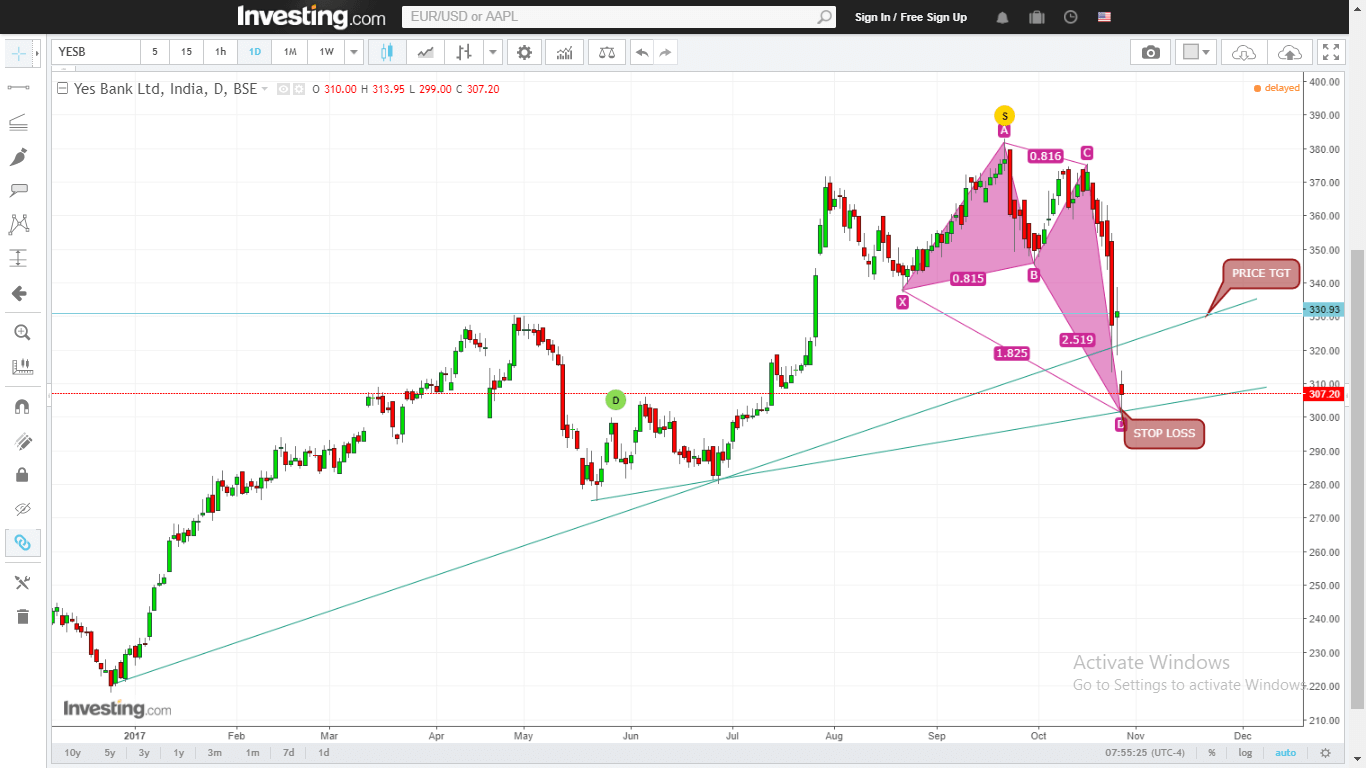
Bullish Butterfly formation in Yes Bank
A Bullish Butterfly is a harmonic pattern which resembles just like a butterfly shape . Its bottom must be confirmed by a long term trend line acting as a long term support the demand area.
Around that support area it has formed a long legged Doji candle which itself shows the uneasiness of short sellers.
Also after confirming the Bollinger Band of 9 periods my observation is that it is likely going to be a good support area because prices making lower lows but after breaking the bands back 2 days ago now prices closing inside the bands.
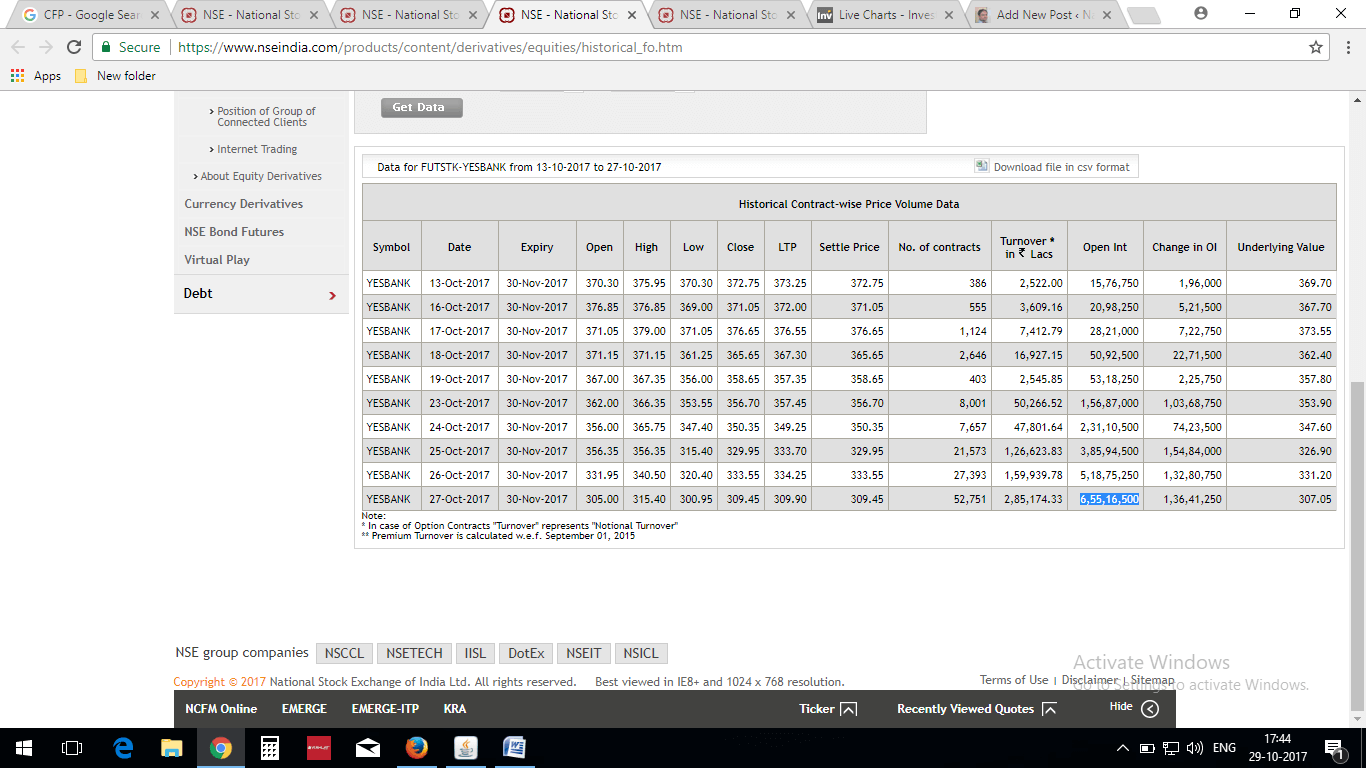
Now just have a look at futures market positions . In October Series on the date 13 Oct.2017 the stocks total open interest was at around 4 lacs share and now in November series total open interest rises to 6.5 lacs shares ,new addition of approximately 2.5 lacs shares. This calculation also confirms that the trend reversal is on the cards as highest open interest build up when the markets is at bottom may be consider as sign of prices reversals.
Here is the snapshot of Open Interest data. Data source : www.nseindia.com