
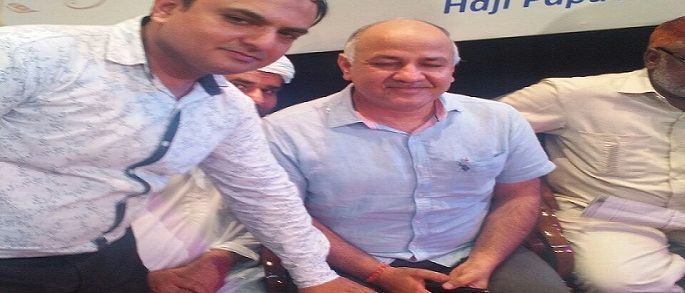
 Nasir Mirza in education fair with Education minister Manish Sisodia


Nasir Mirza is a well Known Financial Analyst having more than 12 year of extensive experience in the field of Financial Market. He has been a regular trader in stock market and Commodity market. Since 2004, he has been trading actively in Financial Market.
Mr Nasir Mirza is a professional mentor for stock market, commodity market and forex market. He is specialized in Technical analysis and Option analysis. He started his financial journey at a very young age.
After a great hold over technical and option analysis, Mr Nasir Mirza today is generating successful tips in both equity and commodity market. He knows lots of technical and options strategies today that actually work in market. He is today providing training on stock market and already has trained more than 1000 students. All of his students are earning great returns from the market today. Today, Mr Nasir is not only a successful trader but also a successful trainer.
His Advice to students: Don’t follow anyone blindly and don’t lose whatever you earned……..Get Trained, learn and research over stock market till you are confident enough to initiate profitable trades……………
Trainer at Delhi Institute of Computer Courses (DICC)
Apart from trading in Equity and Commodity Market, Nasir Mirza provide Training on Stock Market Courses including Financial Analysis, Fundamental Analysis, Derivative Analysis,, Technical Analysis, Option Analysis, Commodity Analysis and Forex Analysis. He also provide coaching for NSE’ NCFM Modules.
Workshops & Seminars:
Nasir Mirza Has delivered so many workshops and seminars in various colleges in India & Abroad. He also provide corporate training to different brooking house in Delhi & NCR. some of his seminar are mentioned as below:
-
- NIIT Jalandher
- IIT Guwahati
- Vigan University, Vijaywada
- SASTRA University, Tamilnadu
- Reliance Money Capital
- Punjab Technical University
- Bits Pilani Dubai
- IIT Kanpur
- Bits Pilani Rajasthan
- & Many more
Technical Analysis Course offered by Nasir Mirza
Technical Analysis is a method through which analyst study, analyze and forecast the direction of prices through the study of past market data. Our Technical Analysis Course has been designed to cover basic to advance methods to analyze the Share Market. We teach in live market hours so that one can study and implement all the strategies on live market.
Technical Analysis never deals with ratios, earnings or sectors. Last three to four decades gave much more importance to technical analysis. Technical analysis helps investors and traders to analyze the future trend using time period. By implementing different technical tools and techniques in a well chronological manner traders can analyze markets for intra-day, short term and medium to long term. Ultimate trends, support and resistance levels, historical price movements can be almost easily forecast using technical analysis.
Course Content and Complete details can be found here: http://www.nasirmirza.in/stock-market-course/